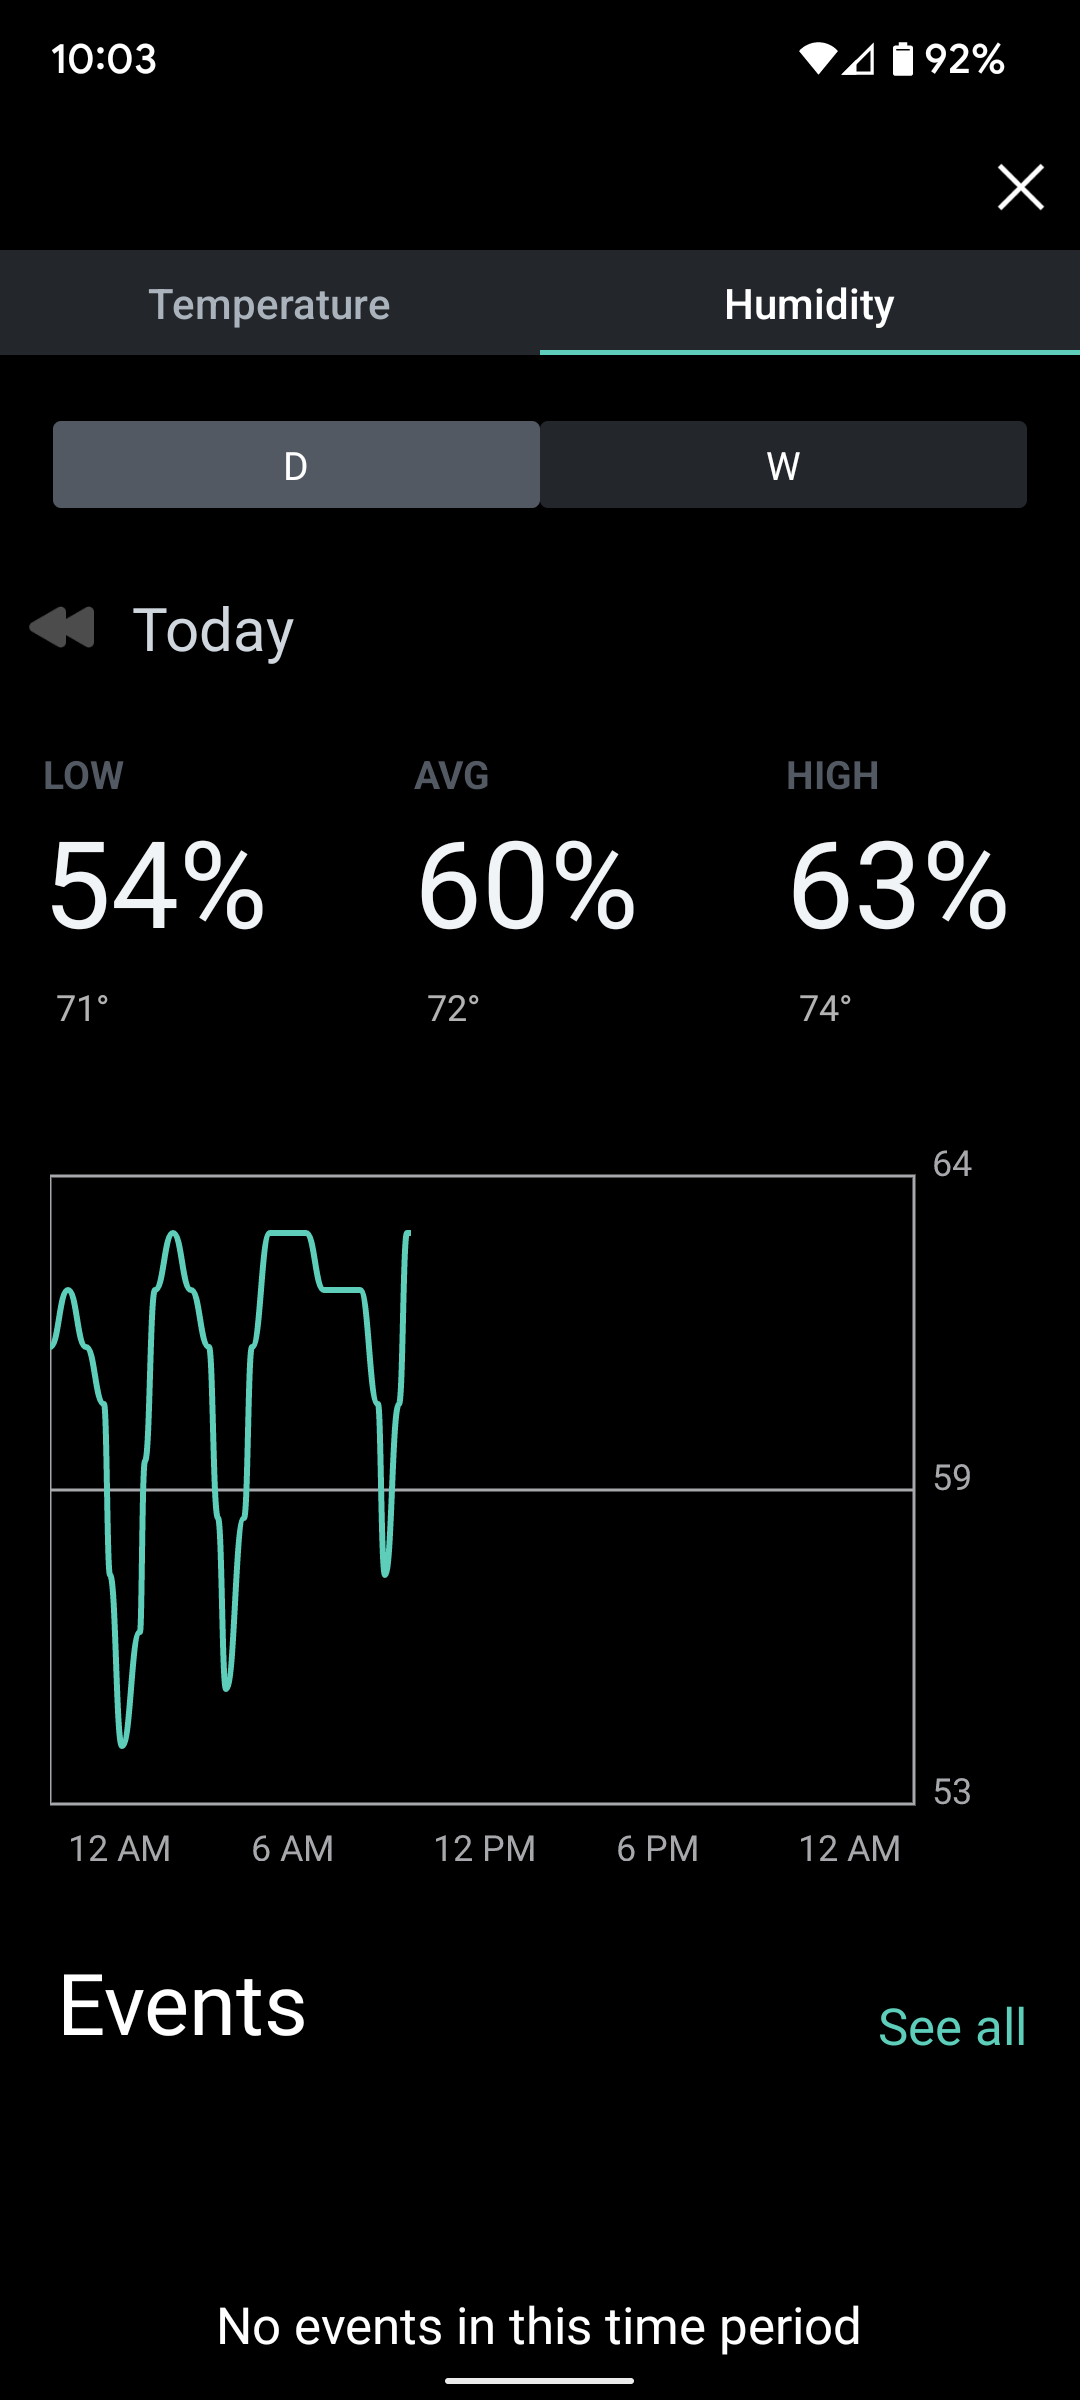
The new Wyze temperature/humidity sensors are great, but the app’s missing some key features. For me the most important is a time chart of humidity. You can see the temperature over time, which is useful, but I don’t see any way to get a chart of humidity. I have problems with condensation in some rooms, so being able to see humidity trends is important to me.
If you’d like to see improved reporting then please click the “Vote” button!
[Mod Note]:Your post was moved to create this new topic in order to maintain single-scope wishlist topics.
Would be nice to see the humidity history in the graph shown on a separate line in the verticals axis vs. sharing the temperature line for those who are interested in monitoring humidity levels.
Totally agree. Two color main UI page graphing for both as well as two color graph on “History” graphs (replacing “Temperature” title)
Also, the entire climate Sensors UI needs some upgrades.
Press the current temp on the main UI page and be taken to the “History” graphs
Press the current humidity on the main UI page and be taken to the “History” with the proposed humidity graphs in a different color along with Temp
Press the graph line at the bottom of the main UI page and be taken to the “History” graph
One little button for graphs in the top right is just not enough when the entire rest of the page is completely link free.
Is it too difficult to spell out Day and Week on those massive buttons instead of D and W on the “History” graphs page?
With adding the graph links mentioned, Replace the graphs link in the upper right with an Events link sporting a friendly notification dot on the icon button for new events that haven’t been viewed. Takes you to the events by day page. (Not yet sure events is even live yet??? Will post in main forum on that)